
How Can Spectral Sensing Improve Air and Water Quality Monitoring?
From Molecular Absorption to Continuous Environmental Monitoring and Early Warning.
Environmental pollution does not always occur at predictable times. Industrial emissions, abnormal odours, wastewater discharge, and changes in river conditions can develop between conventional sampling intervals.
Multi-channel spectral sensing offers a way to continuously observe changes in environmental conditions by measuring optical responses across ultraviolet (UV), visible (Vis), and near-infrared (NIR) wavelengths. By combining spectral fingerprints, reference measurements, and data analysis, monitoring systems can identify unusual patterns and highlight when further investigation is needed.
The key advantage is not simply detecting a pollutant—it is identifying changes early enough to guide targeted testing and environmental action.
1. Principles of Spectral Sensing
How Molecular Absorption Reveals Chemical Information
Molecules interact with light according to their chemical structures, molecular bonds, and functional groups. When light passes through or interacts with a sample, certain wavelengths may be absorbed through electronic transitions or molecular vibrations. The resulting wavelength-dependent response provides information about the sample's composition and physical properties. [1]
Understanding UV, Visible and NIR Responses
Different spectral regions reveal different types of information.
| Spectral Region | Main Principle | Typical Chemical Information |
|---|---|---|
| Ultraviolet (UV) | Electronic transitions | UV-absorbing molecules, aromatic and conjugated compounds |
| Visible (Vis) | Electronic transitions and optical scattering | Coloured compounds, selected gas absorbers and particle-related responses |
| Near-Infrared (NIR / SWIR) | Molecular vibrational overtones and combination bands | O–H, C–H and N–H related absorption features |
In UV–Vis spectroscopy, light absorption is commonly associated with electronic transitions in molecules or light-absorbing groups. In NIR spectroscopy, absorption is mainly associated with overtones and combinations of molecular vibrations. Bonds such as O–H, C–H and N–H contribute characteristic features to the spectral response. [1]
Multi-Channel Spectral Fingerprinting
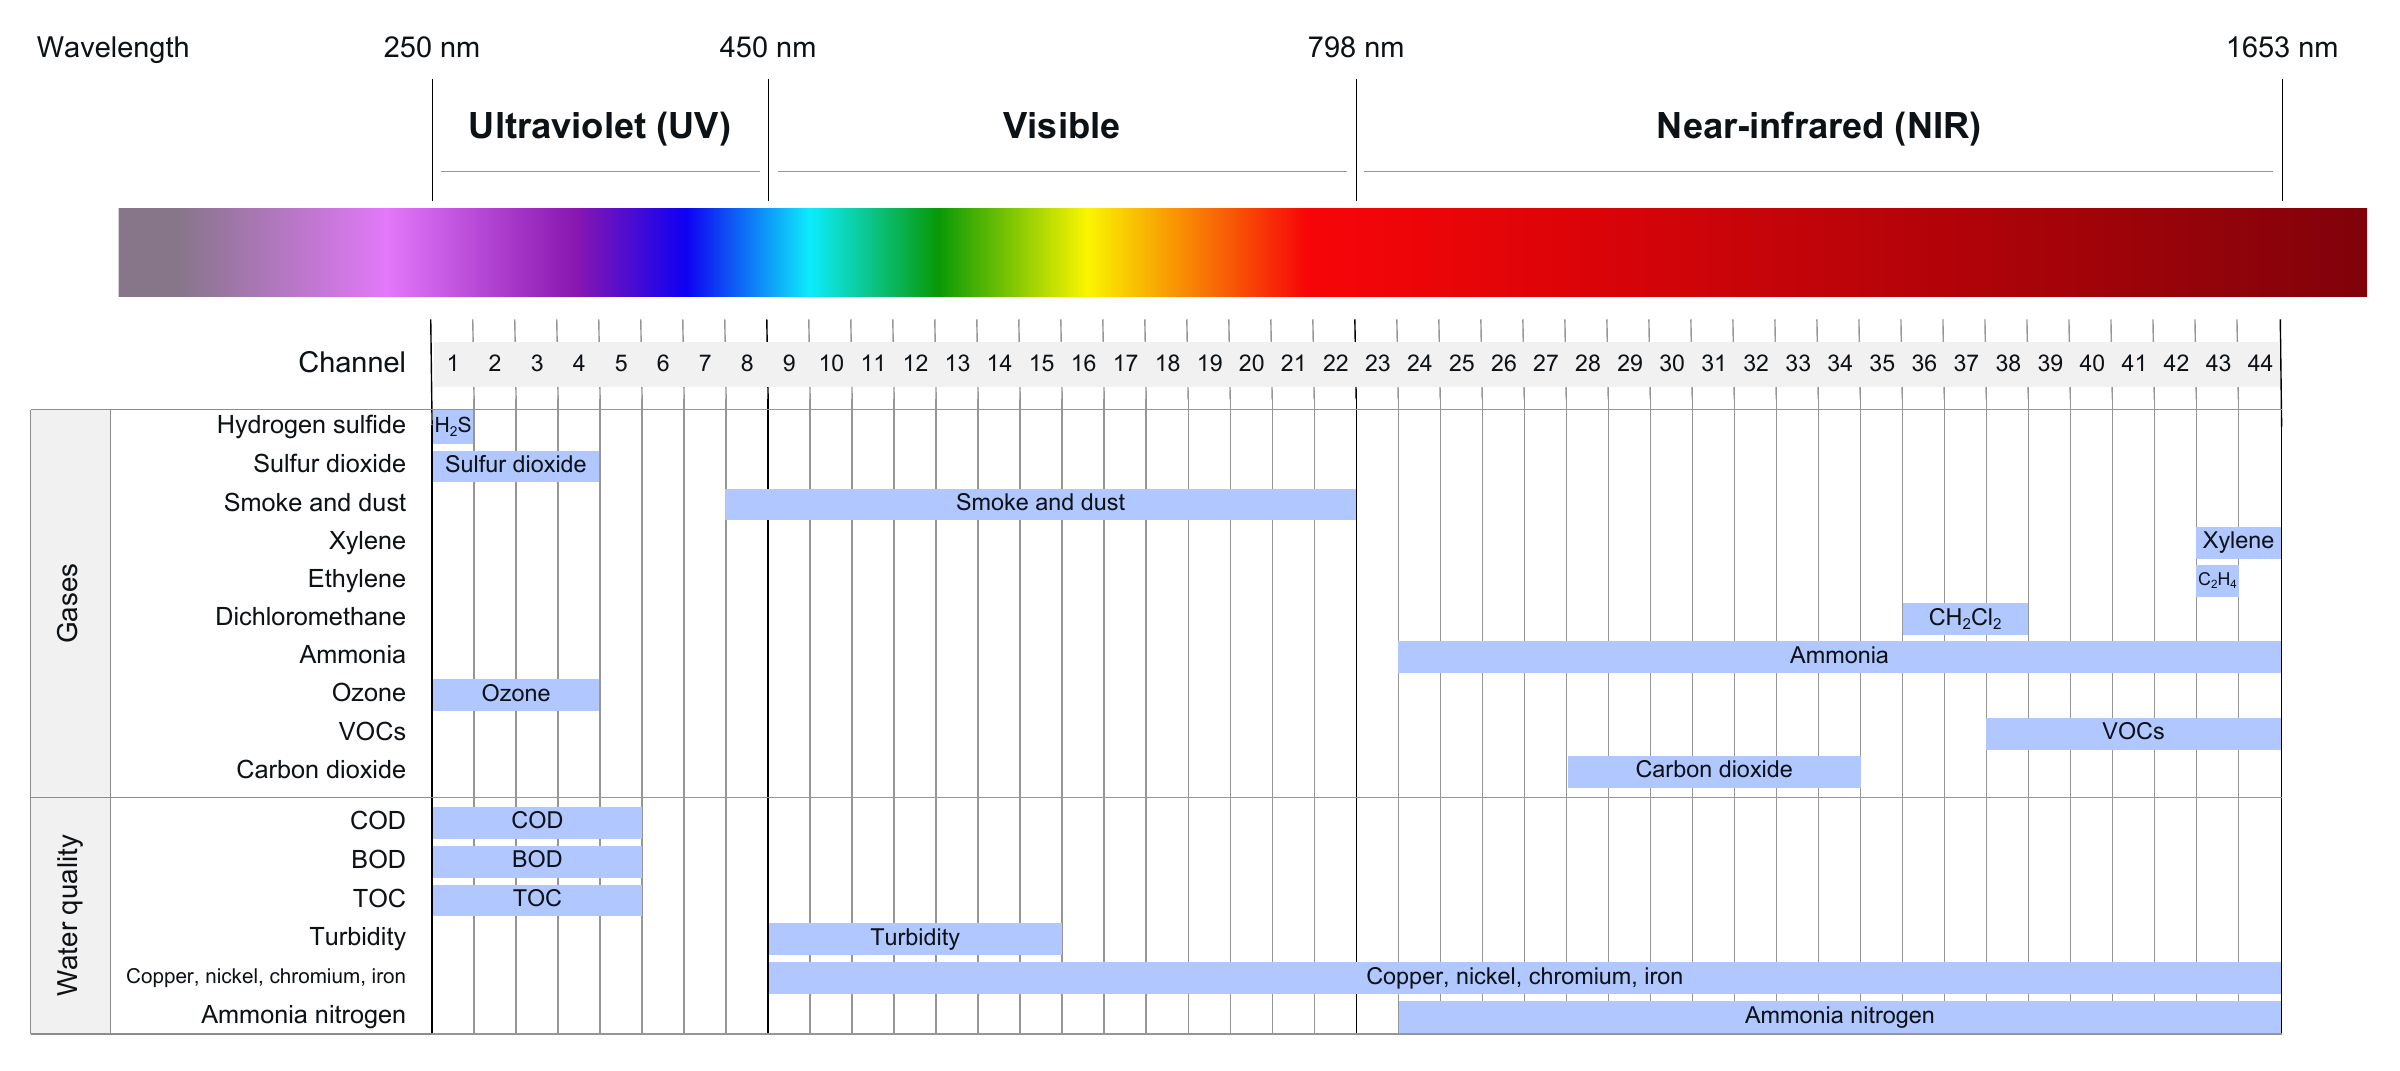
Compact spectral sensing platforms can capture optical measurements across multiple discrete wavelength channels. For example, a 44-channel UV–Vis–NIR sensing architecture provides wavelength coverage across approximately 255–1700 nm, including:
- UV: 255–400 nm
- Visible: 400–780 nm
- NIR: 780–1100 nm
- Short-Wave Infrared (SWIR): 1100–1700 nm
Rather than relying on one measurement, the combined channel responses create a spectral fingerprint that can be compared with reference data. Changes in these fingerprints can indicate changes in sample composition, environmental conditions, or the presence of abnormal optical signatures. With suitable calibration and analytical models, spectral fingerprints can support environmental classification, trend monitoring, and anomaly detection.
2. Air Quality & Gas Monitoring
Detecting Abnormal Gas Patterns Through Spectral Fingerprinting.
Industrial emissions and environmental odours often involve mixtures of gases, volatile organic compounds (VOCs), and airborne particles. Different gases may exhibit characteristic optical absorption features within UV, visible, or infrared regions. Particles can also influence optical measurements through scattering and attenuation. [2, 3]
Understanding Spectral Responses in Air Monitoring
Different wavelength regions can contribute information relevant to environmental gas monitoring.
| Spectral Region | Potential Monitoring Information |
|---|---|
| UV | Absorption associated with selected sulphur-containing gases, ozone, and other UV-active species |
| Visible | Selected gas absorption features, including NO₂, together with smoke and particle-related optical changes |
| NIR / SWIR | Selected hydrocarbon-related absorption features and broader gas-mixture responses, depending on instrument configuration |
Environmental spectral-monitoring applications may target gases and indicators such as hydrogen sulphide (H₂S), sulphur dioxide (SO₂), ozone (O₃), ammonia (NH₃), selected hydrocarbons, VOC-related patterns, and particulate-related signals. The information obtained depends on the wavelength channels, optical configuration, sampling conditions, and calibration models. Not every listed substance can be directly distinguished or quantified by a general-purpose multi-channel sensor.
From Gas Fingerprints to Early Warning
A spectral monitoring system can establish reference fingerprints representing normal environmental conditions. As new measurements are collected, the system compares incoming spectral responses against these reference profiles. Significant deviations may indicate abnormal emissions or changes in gas composition.
Continuous monitoring provides several practical advantages:
- Identification of unusual gas-pattern changes
- Early-warning alerts for abnormal conditions
- Monitoring of emission trends over time
- Comparison of environmental conditions across multiple locations
- Supporting evidence for investigating odour complaints and possible emission sources
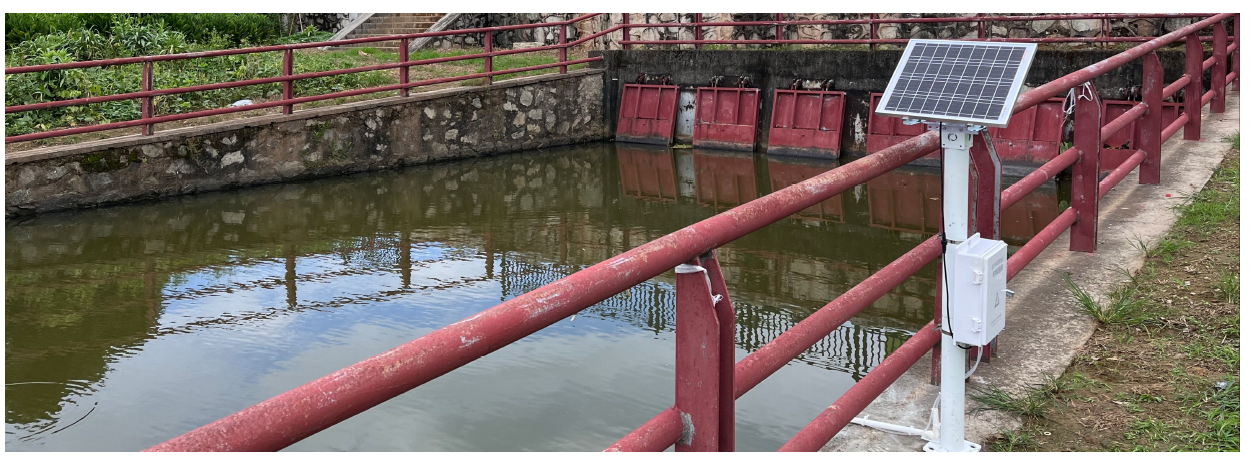
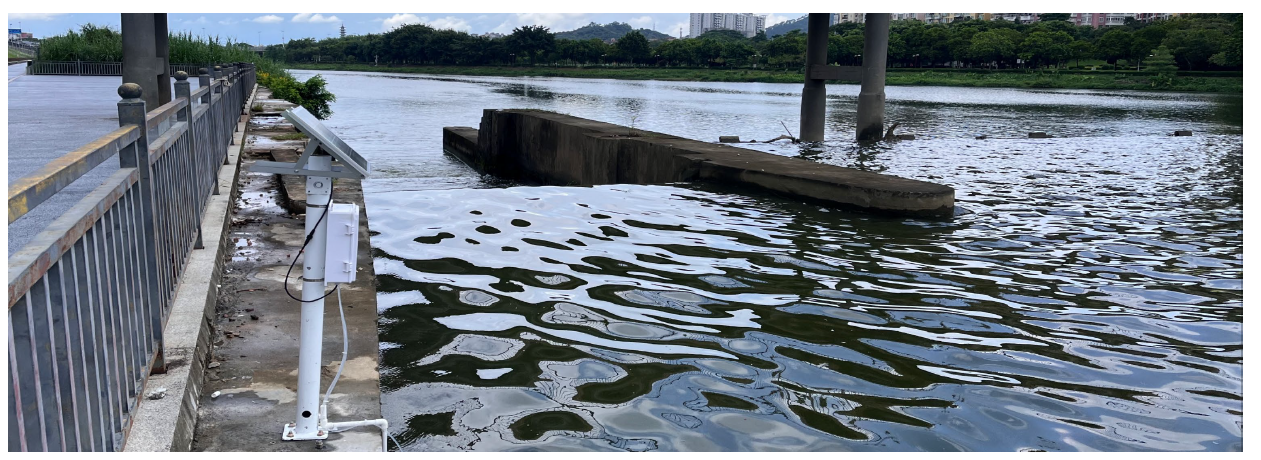
For example, monitoring instruments installed across an industrial area can record when unusual gas patterns occur. By comparing the timing and location of alerts with operating activities, weather information, and complaints, environmental operators can narrow down where further investigation is required.
From Monitoring to Targeted Testing
An abnormal spectral fingerprint is an indication that environmental conditions have changed. It can prompt targeted sampling or confirmatory analysis using a suitable gas analyser or laboratory method. This allows investigation resources to be focused on suspicious locations and periods rather than relying solely on occasional, untargeted sampling.
When abnormal gas patterns are detected, targeted laboratory analysis can provide more detailed chemical information. Techniques such as Gas Chromatography–Mass Spectrometry (GC-MS) can identify and quantify selected volatile organic compounds (VOCs), while appropriate gas-specific analysers can investigate other suspected pollutants.
3. Water Quality Monitoring
Tracking Water Quality Changes Through Multi-Wavelength Spectral Analysis.
Water quality can be affected by organic pollutants, industrial discharge, suspended particles, nutrients, and other dissolved substances. These constituents influence how light is absorbed, transmitted, reflected, or scattered by water. UV–Vis–NIR spectroscopy provides optical information that can be used to monitor changes in water composition and develop predictive models for selected water-quality parameters. [4, 5]
Understanding Spectral Responses in Water
Different wavelength regions provide complementary information.
| Spectral Region | Potential Water Quality Information |
|---|---|
| UV | UV-absorbing dissolved organic matter and organic pollution indicators |
| Visible | Water colour, suspended particles, and turbidity-related optical changes |
| NIR / SWIR | Water O–H absorption features, sample-matrix characteristics, and additional information for multivariate analysis |
For example, UV absorption near 254 nm is widely used as an indicator of certain UV-absorbing organic substances. Visible-region measurements can contribute information about water colour and suspended matter, while near-infrared measurements provide additional information associated with molecular vibrations and water composition.
From Spectral Fingerprints to Water Quality Indicators
Individual water-quality parameters do not necessarily correspond to one unique absorption wavelength. Instead, multi-wavelength spectral measurements can be combined with calibration models developed using laboratory reference results.
Potential monitoring applications include:
- Chemical Oxygen Demand (COD)
- Biochemical Oxygen Demand (BOD)
- Total Organic Carbon (TOC)
- Turbidity and suspended matter
- Ammonia nitrogen
- Selected metal-related water quality indicators
COD, BOD, and TOC can be estimated through calibrated relationships between spectral patterns and laboratory measurements. [4–6] Other indicators, including ammonia nitrogen and selected metals, may require additional measurement chemistry, complementary sensors, or application-specific calibration. The resulting models can support continuous tracking of water-quality changes and help identify departures from normal conditions.
From Continuous Monitoring to Targeted Investigation
Real-World Example: Drinking Water Discolouration in Hong Kong
In July 2022, residents in Ma On Shan, Hong Kong, reported yellowish tap water. The Water Supplies Department attributed the discolouration to a temporary disruption in manganese removal at a water treatment works, while confirming that the water met drinking-water standards. This incident highlights the potential value of continuous optical water-quality monitoring, where changes in water colour and spectral fingerprints can provide early indications of abnormal conditions that might otherwise be missed between routine sampling intervals.
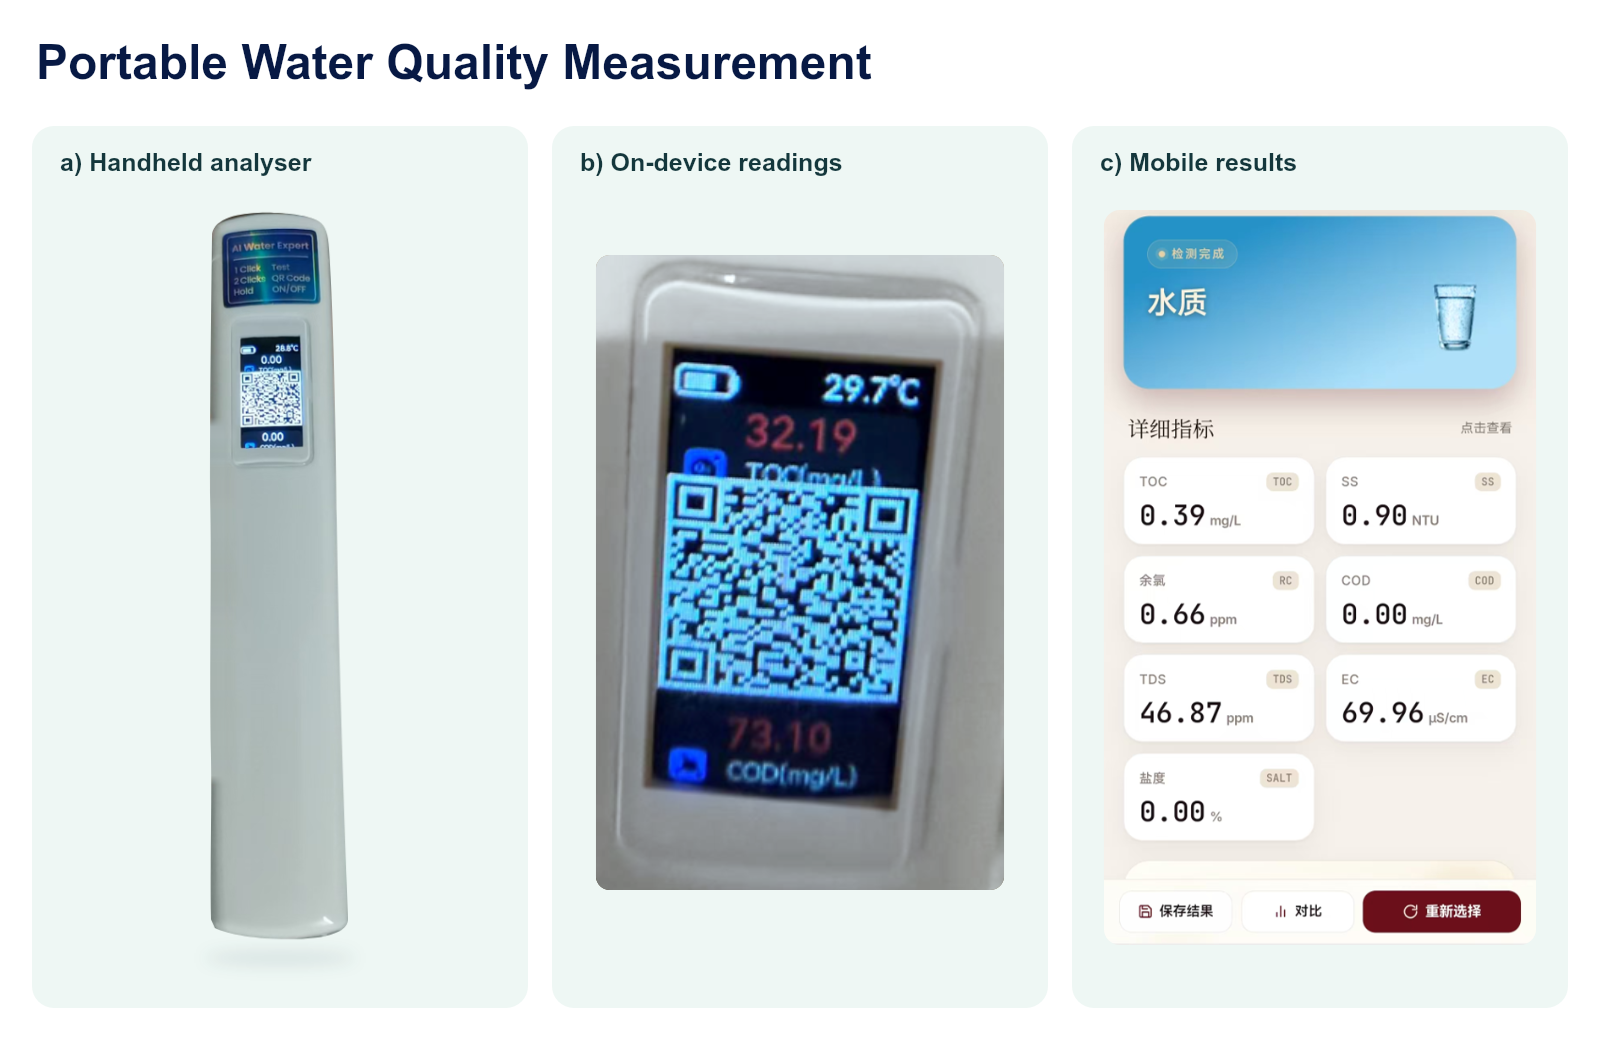
When unusual changes are detected, operators can investigate the affected locations using portable water sensing systems for rapid on-site assessment. An integrated portable device can combine water-quality measurement, data processing, and a digital interface, allowing users to review multiple indicators immediately and determine whether further analysis is required.
For more detailed chemical identification and confirmation, laboratory techniques such as ICP-MS for trace metals, chromatography for selected organic pollutants, and standard COD, BOD or TOC testing can provide further information. Together, continuous monitoring, portable screening, and targeted laboratory analysis enable earlier investigation, more efficient testing, and better-informed environmental management.
Reference: Oriental Daily News, 2 August 2022.
Have an Environmental Monitoring Challenge?
From continuous spectral monitoring and early-warning systems to targeted sampling, laboratory analysis, and system integration, B&G supports comprehensive air and water quality monitoring solutions.
Working with specialist laboratories and research partners, we help clients investigate environmental abnormalities, verify findings, and identify practical next steps.
References
- Pennsylvania State University, Materials Research Institute. Ultraviolet-Visible-near-IR Spectroscopy. Technical reference on UV–Vis electronic transitions and NIR vibrational overtones.
- Davari, M., Bahreini, M., & Ghaemi, A. (2026). A comprehensive review of the performance of optical techniques in the sensing of pollutant gases. Measurement: Sensors, 44, 101997.
- A mini broadband cavity enhanced absorption spectrometer for nitrogen dioxide measurement on the unmanned aerial vehicle platform. Atmospheric Environment, 321, 120361 (2024).
- Kumar, M., Khamis, K., Stevens, R., Hannah, D. M., & Bradley, C. (2024). In-situ optical water quality monitoring sensors—applications, challenges, and future opportunities. Frontiers in Water, 6, 1380133.
- Qi, X., Lian, Y., Xie, L., Wang, Y., & Lu, Z. (2024). Water quality detection based on UV-Vis and NIR spectroscopy: A review. Applied Spectroscopy Reviews, 59(8), 1036–1060.
- Zhao, Y., et al. (2025). Interpretable data-driven chemometric approach for predicting non-optically active water quality parameters using ultraviolet-visible-near infrared absorption spectroscopy and physical-chemical measurements. Spectrochimica Acta Part A, 331, 125768.